How does wetland biodiversity change with restoration strategies

Assessing biodiversity changes using scenario analysis

I designed the workflow to assess the impact of various restoration and management strategies in line with the EU Nature restoration law on wetlands biodiversity in various climate scenarios for D4.4 of the WET Horizons project.

Role: Conceptualised, designed and executed the research
Methods: Species Distribution Modelling, Climate Scenario Analysis
Tools: R, ArcGIS
Project visualization

Overview

The Challenge

More than 80% of European habitats are in poor conditions including wetlands. The regulation aims to restore ecosystems, habitats across EU to enable long term sustained recovery of biodiversity and ecosystem services. The law aims at restoring least 20% of the EU’s land and sea areas by 2030, and ultimately all ecosystems in need of restoration by 2050.

For wetlands such as peatlands, the goal is to restore drained peatlands such that 30% by 2030, increasing to 60% by 2040 and 90% by 2050.

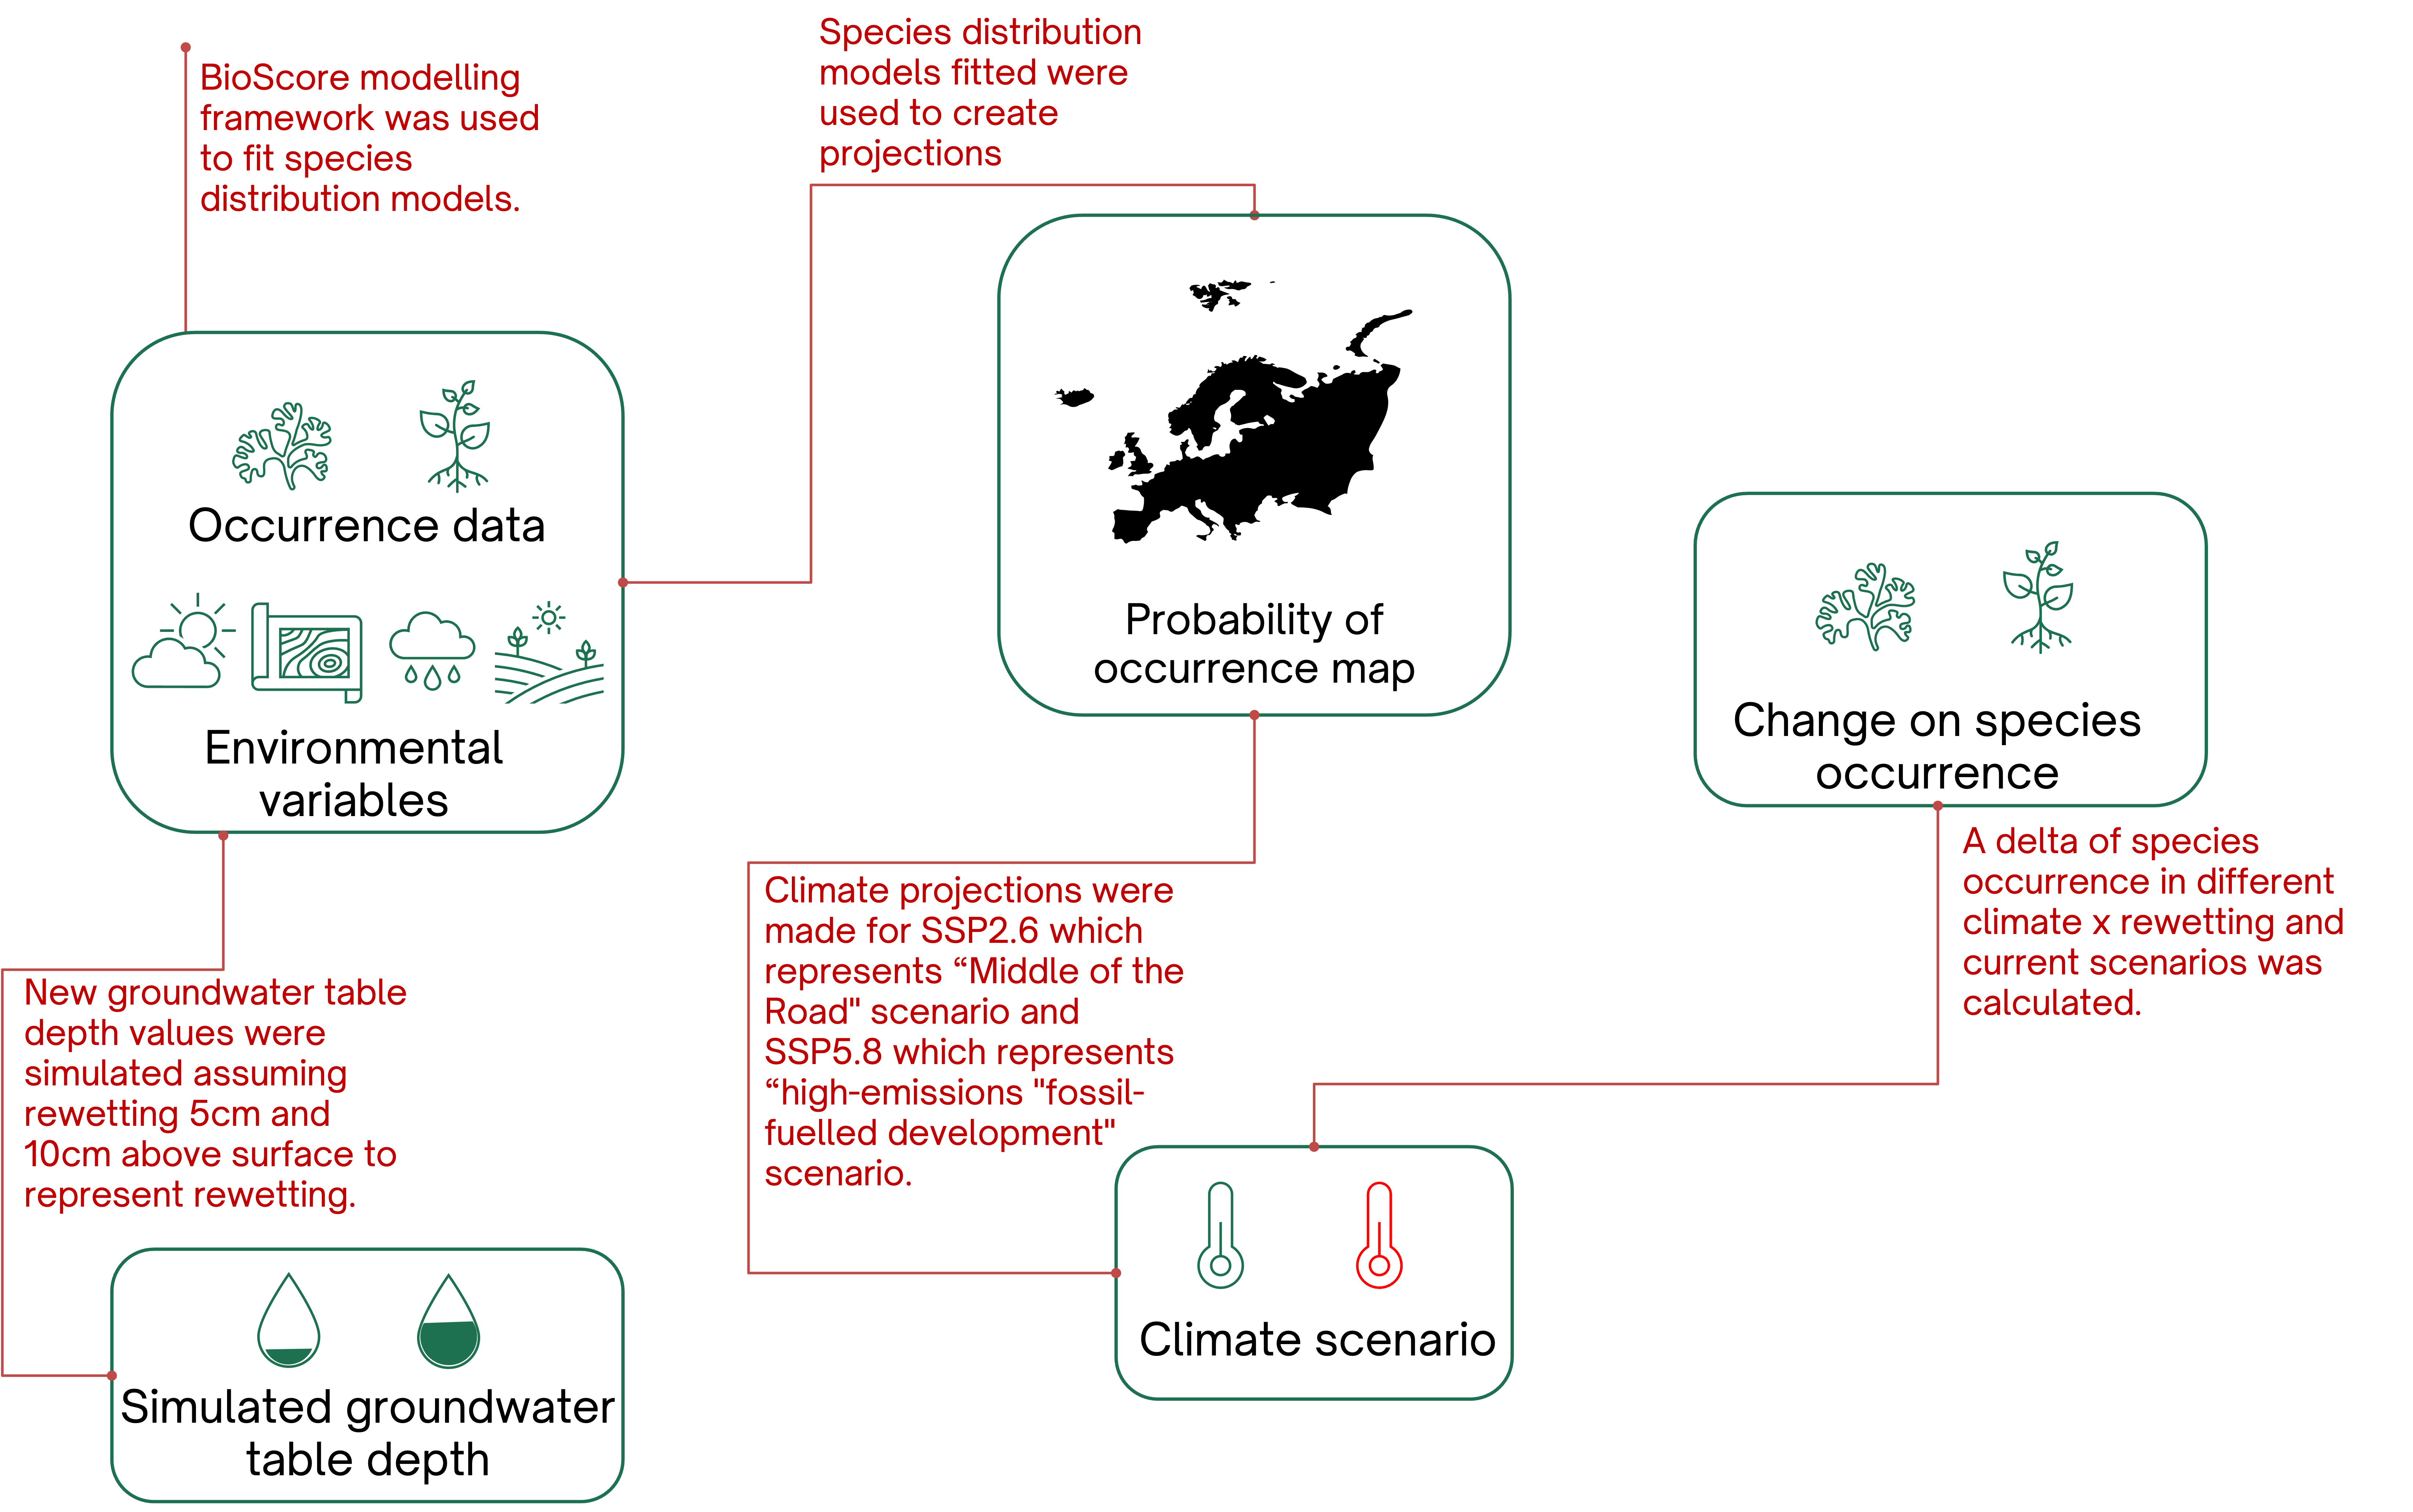
I created scenarios for restoration which essentially translated as re-wetting of drained peatlands under various climate scenarios represented by the Representative Concentration Pathways (RCPs) and Shared Socio-economic Pathways (SSPs).

Pika habitat migration animation
Location: Lille Vildmose Nature reserve, Denmark

Research question

I engaged with stakeholders and formulated the following guiding questions:

1. How to make the connection between restoration strategies and the environmental predictors that are used as inputs in the model?

2. How to best convey the effects of restoration without oversimplifying or overgeneralizing the complexity of ecological systems?


Methods

Methods workflow diagram

I simulated new groundwater table depth values to represent rewetting and modelled the biodiversity outcomes of in two climate scenarios. With one climate scenario representing a low-emission pathway and the other business as usual.

To create scenarios which represent restoration of wetlands, rewetting was simulated by adjusting groundwater table depth values in the model. Climate scenarios were selected to represent two different pathways: one low-emission and one business-as-usual which were an average of 5 different climate models. The projections were also made for the years 2011-2040 and 2041-2070. Partners leading the deliverable 4.4 performed further analysis on the results.

As of February 2024, the project is ongoing and results are being finalized by project partners.


Reflections

I had an interesting time managing expectations during this project. The project was a collaboration between multiple partners and required careful coordination and communication.


Hand drawn illustration by Ojaswi Sumbh