What does the European wetland plant biodiveristy look like?

Developing spatial explicit species specific models for European wetlands biodiversity

I developed and validated species distribution models for European wetlands as part of the WET Horizons project. I led the biodiversity assessment for this project serving as primary analyst for the species distribution modelling.

This work was part of key deliverables D4.2, D4.3 and my second first author publication!

Role: Conceptualised, designed and executed the research
Methods: Species Distribution Modelling, Spatial Analysis, Scientific writing
Tools: R, ArcGIS
Publication: Ecology and Evolution
Wetland landscape

Overview

The Challenge

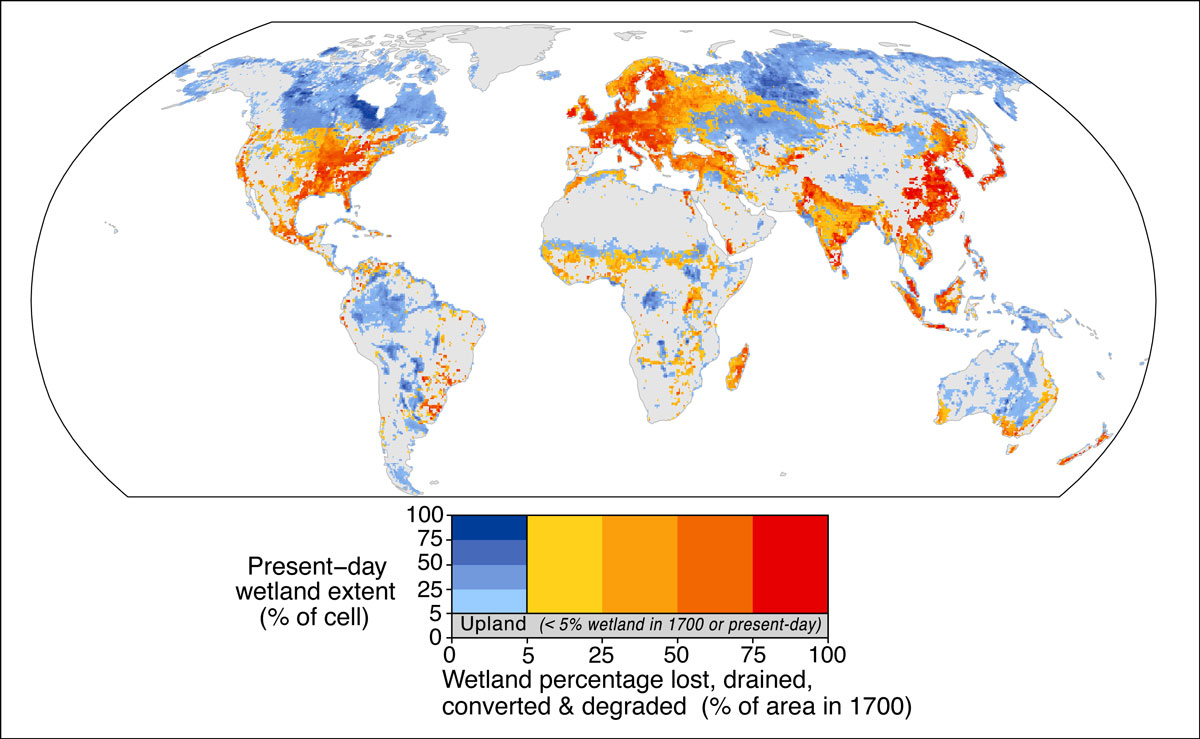
Approximately 5%–8% of the global land surface is categorized as wetlands, which comprise 20%–30% of the world's carbon pool (Salimi et al. 2021). However about 21% of wetlands have been lost since 1700.

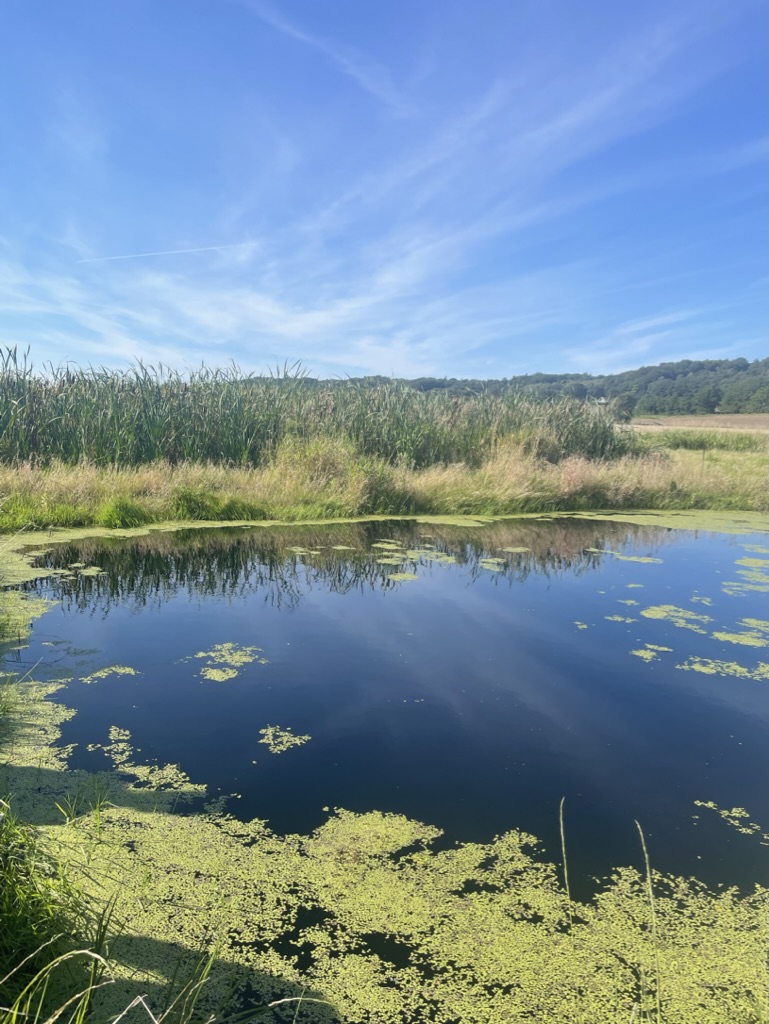
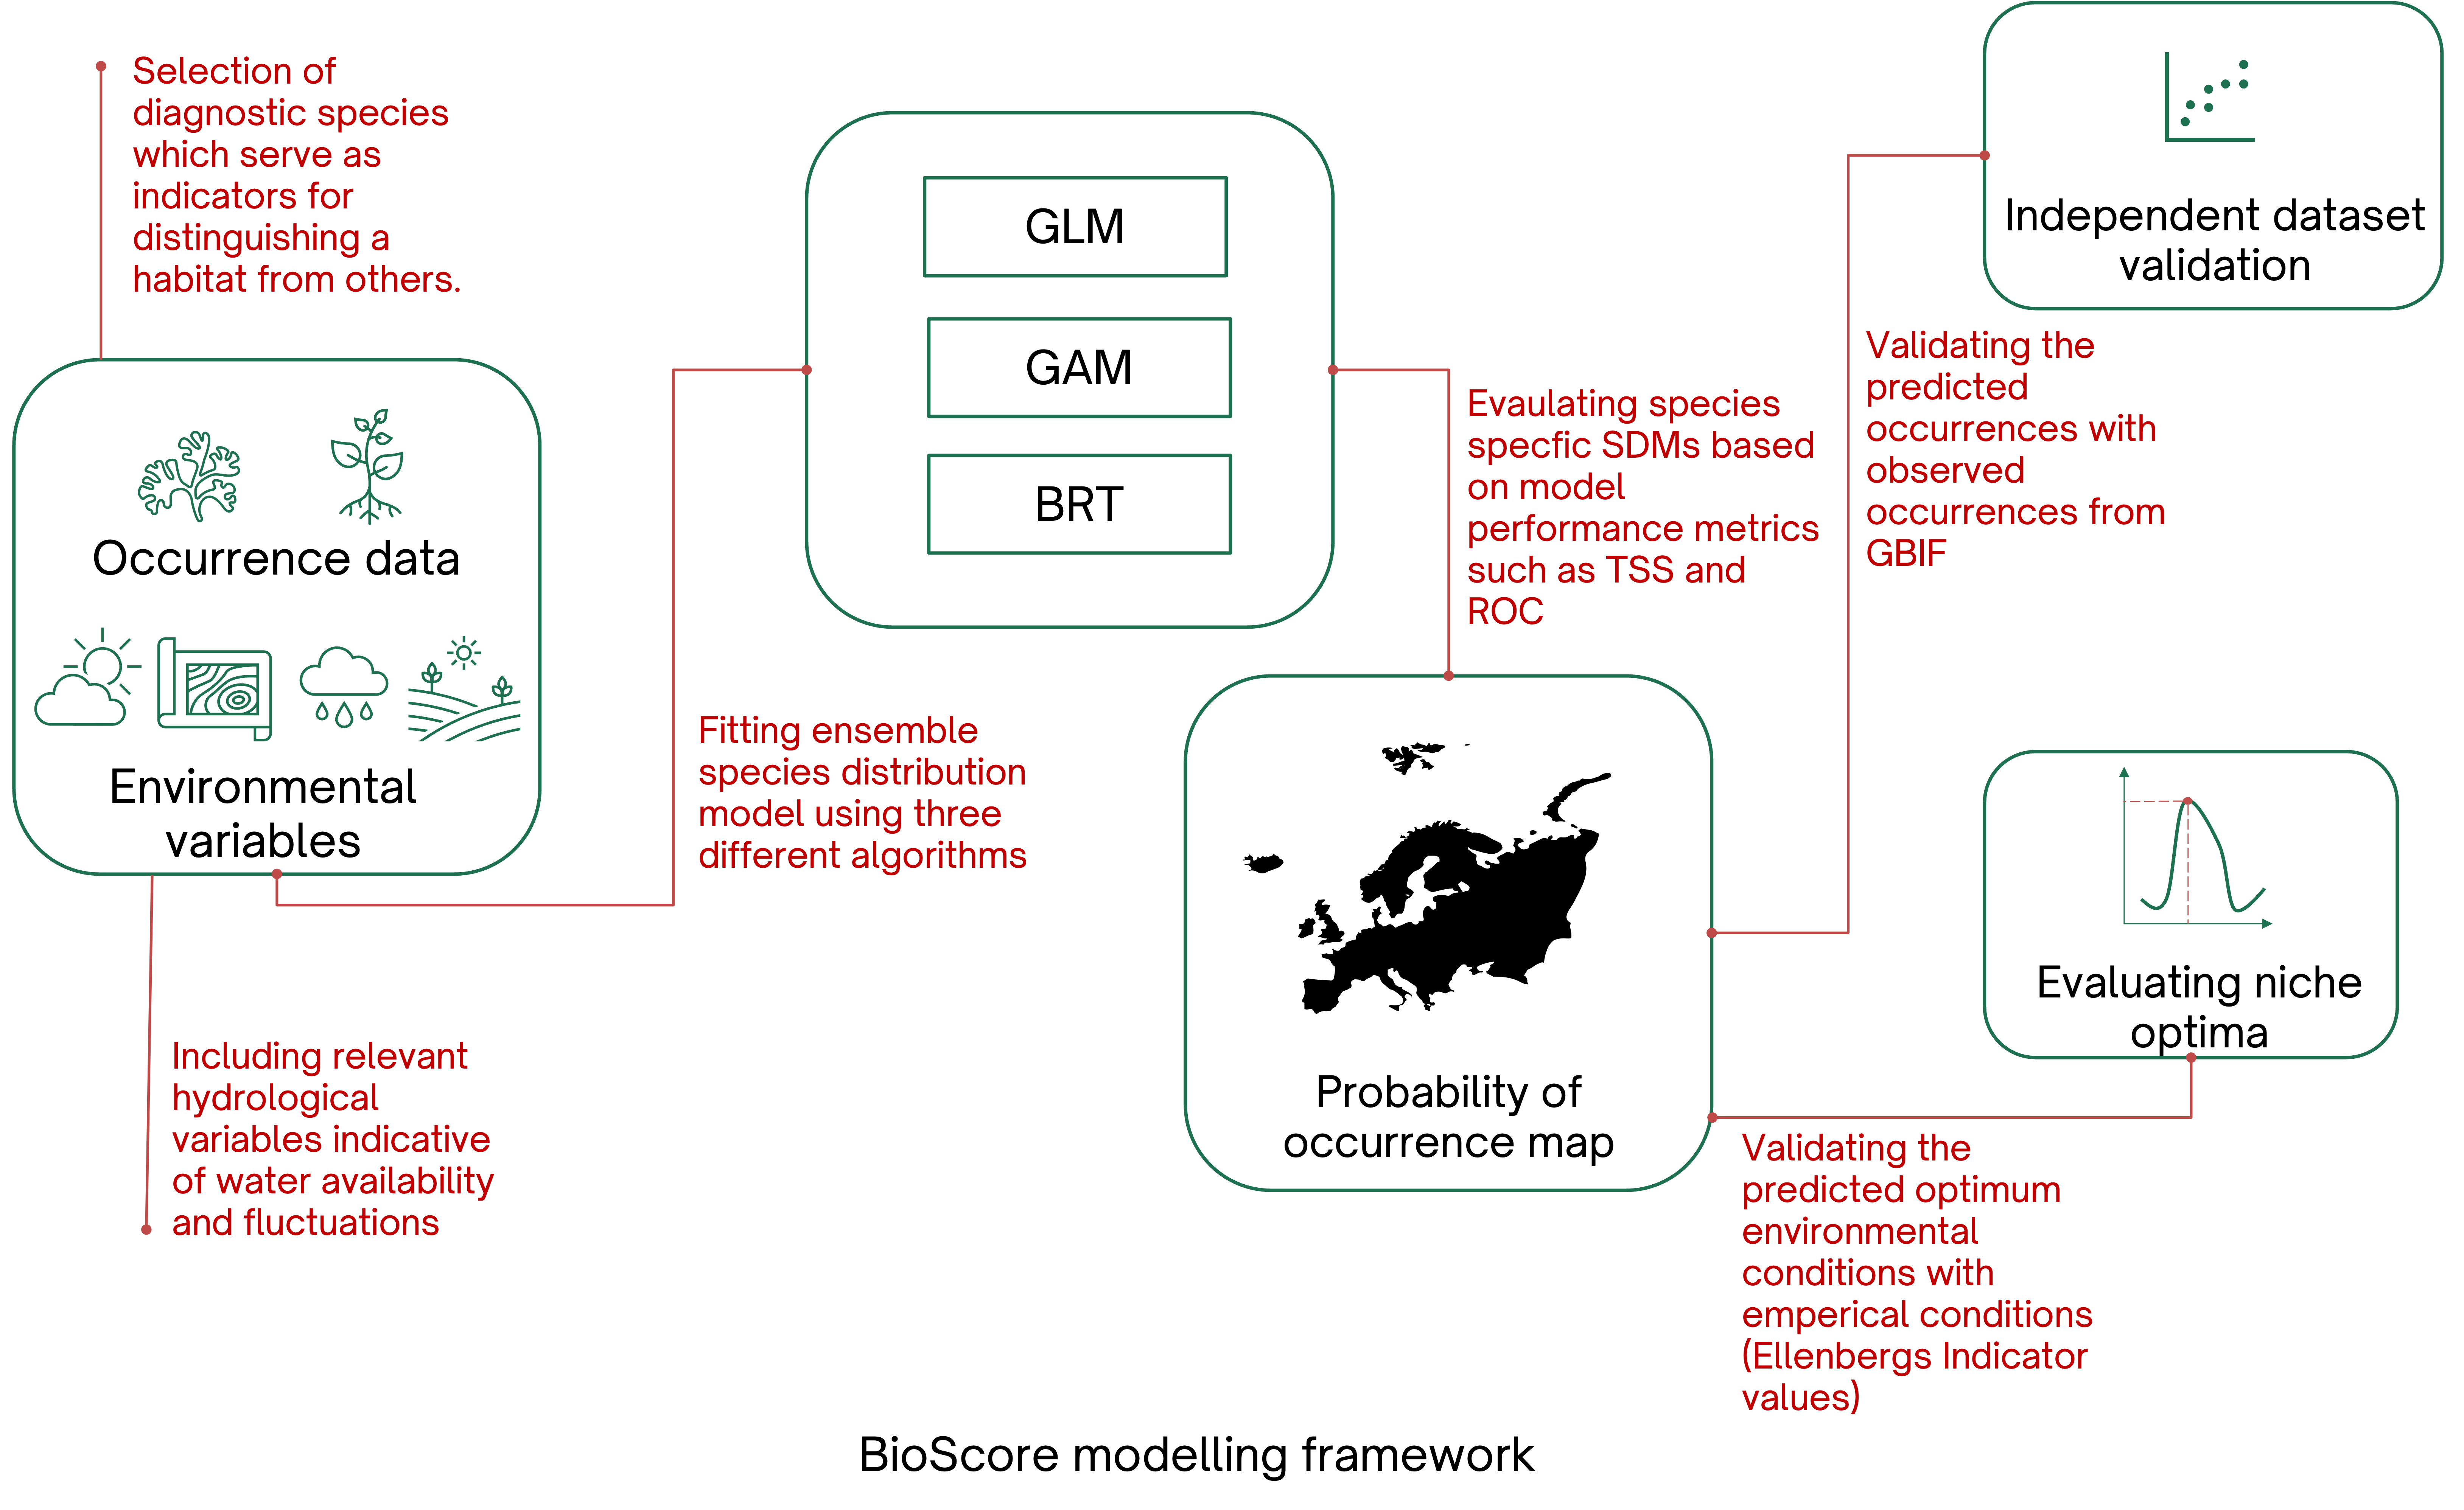
Policymakers, scientists, and conservationists recognize the urgency to halt the loss of wetlands and their unique biodiversity as reflected by various (inter)national agreements and targets related to biodiversity and sustainable development. Species distribution models (SDMs) are extensively used to evaluate potential responses to projected climate change. However, SDMs representative of the unique biodiversity of wetlands are still in their infancy, and existing SDMs of wetland species typically have a limited geographic extent and miss out on moss species

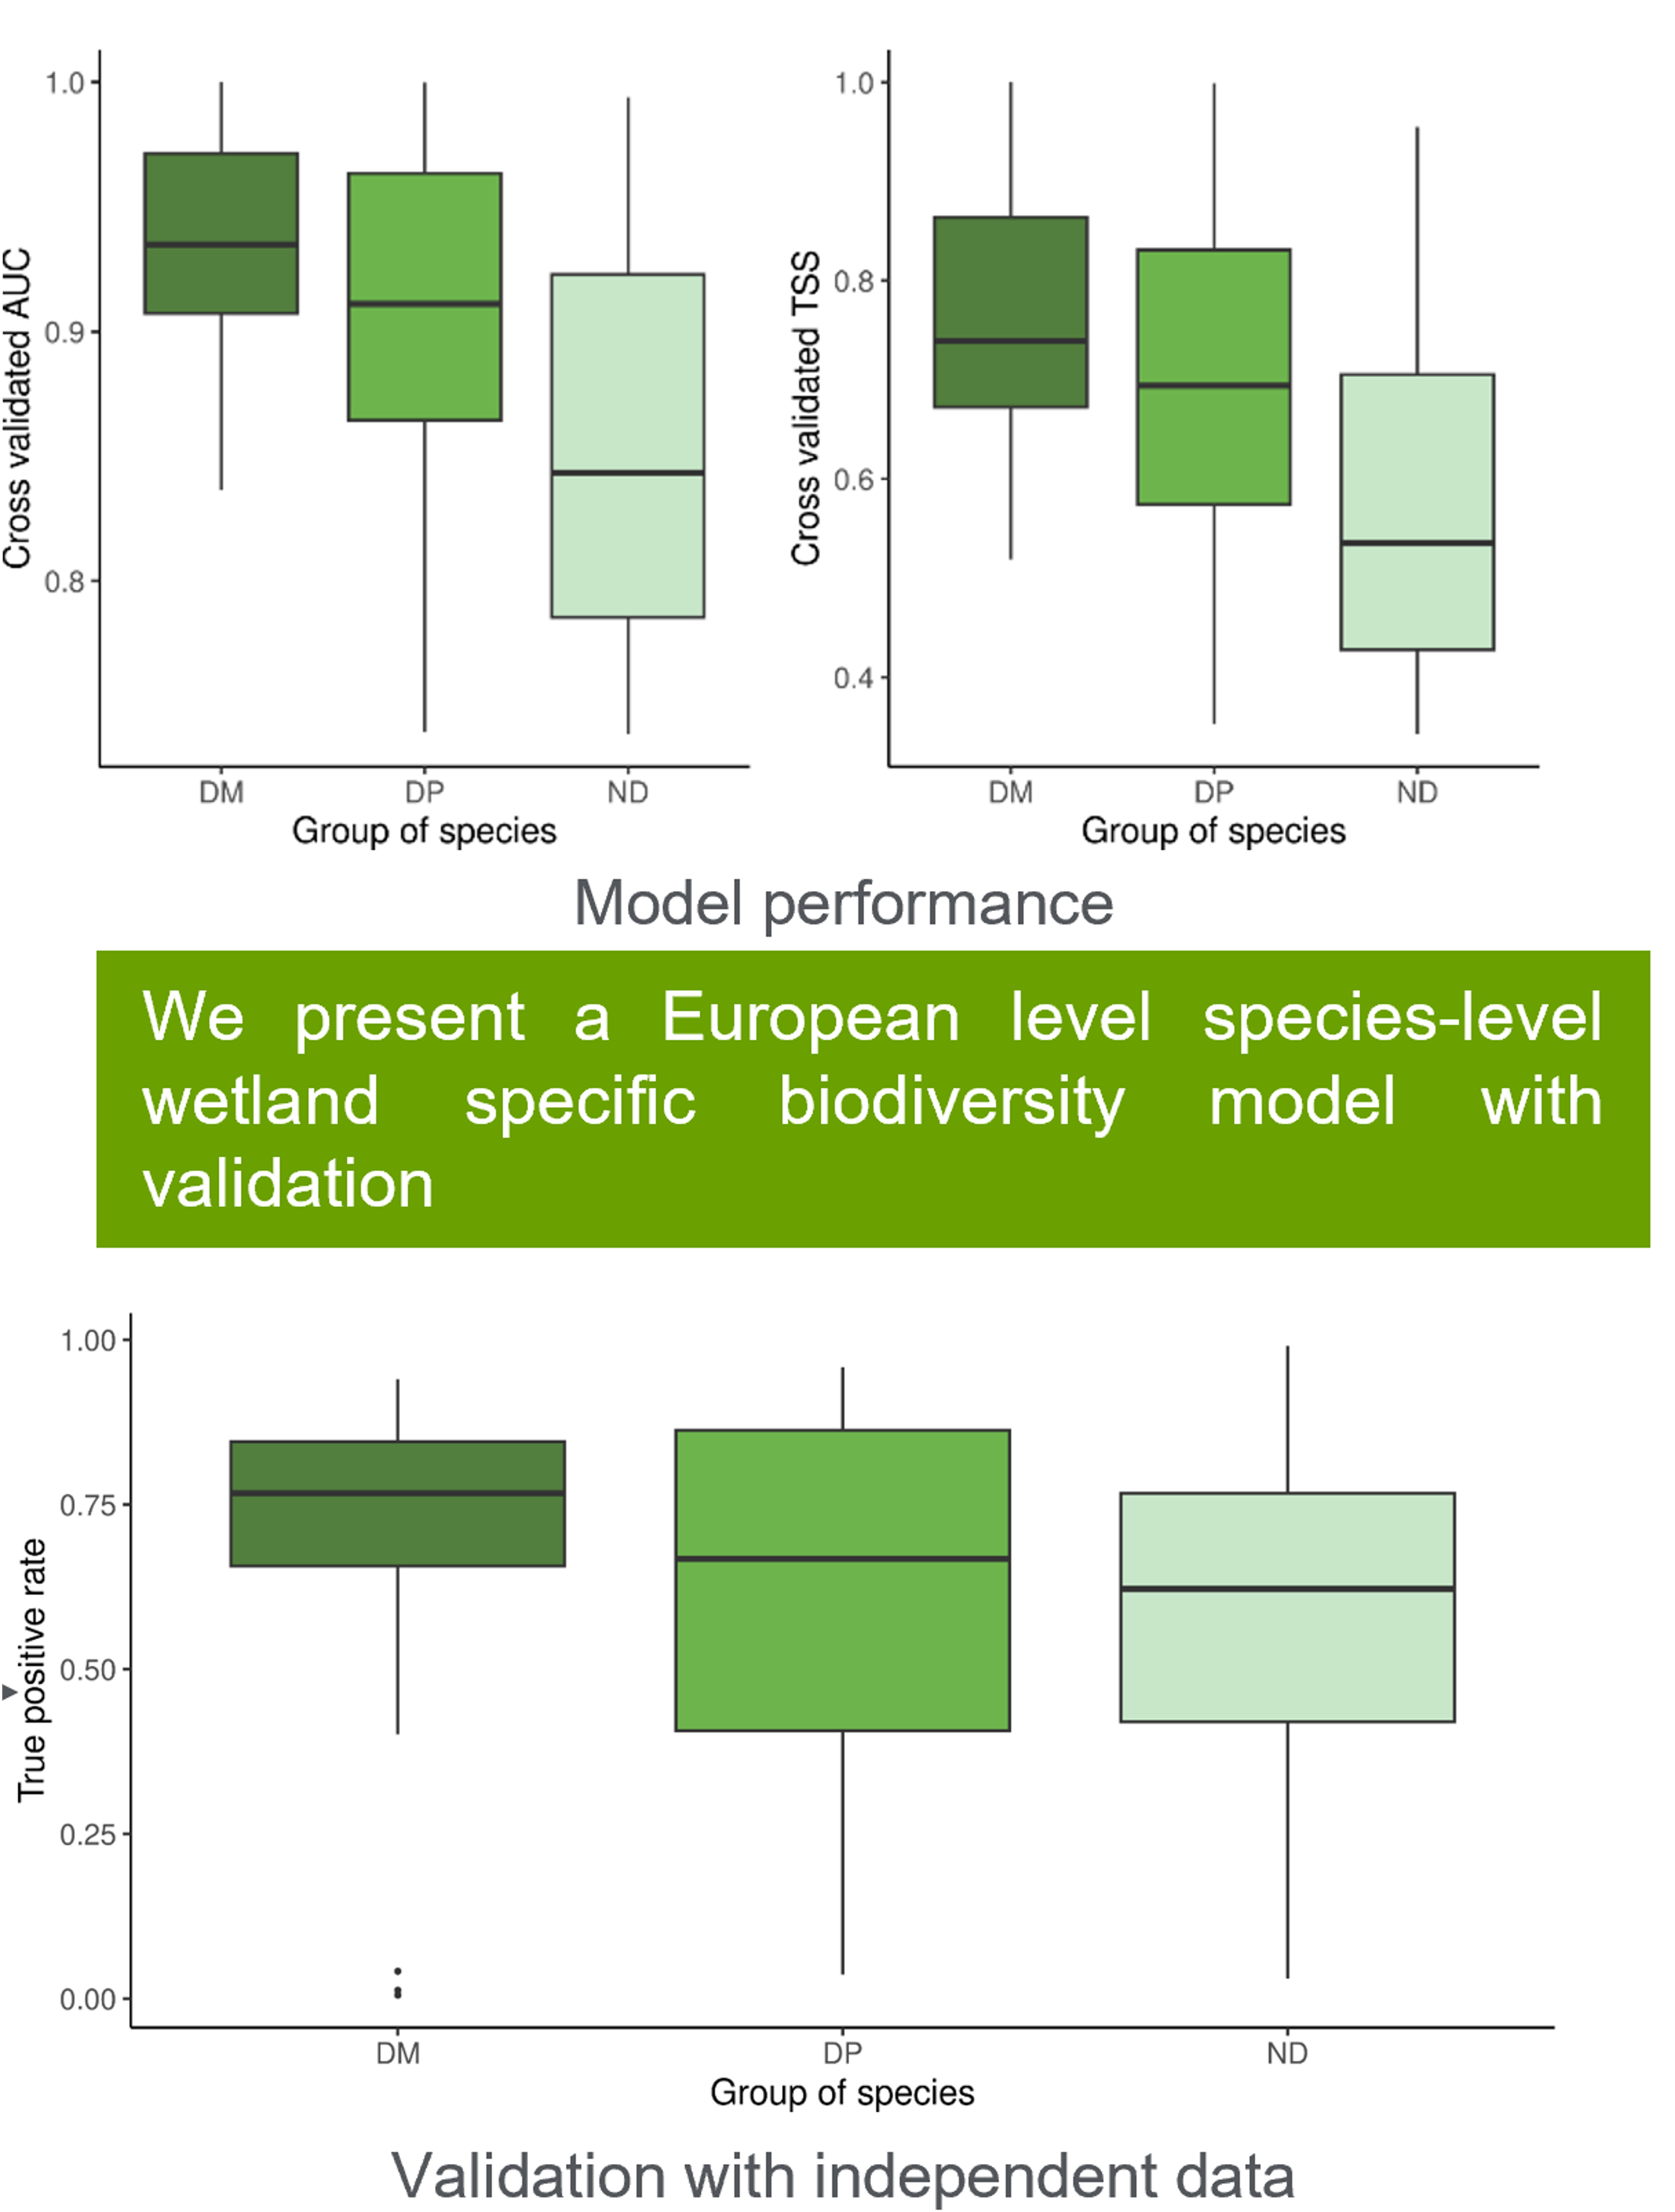
I developed comprehensive SDMs for 265 vascular plants and moss species characteristic of European wetlands, incorporating environmental variables representing climate, soil, hydrology, and anthropogenic pressures to guide conservation planning.


Research question

I framed my work around how I can expand the existing species distribution modelling framework, BioScore to wetland species? I specifically focused on:

1. What species remain underrepresented in current SDMs?

2. Which environmental drivers (climate, hydrology, land use, soil) should I include that most strongly determine wetland species distributions?

3. Taking into account the data constraints and availability, how do the models perform across different taxonomic groups?


Methods

Methods workflow diagram

I led the full ecological modelling pipeline, from collecting raw species records to adapting the modelling framework.

BioScore modelling framework initially modelled only terrestrial vascular plants. The new module allowed the extension to include wetlands vascular and non-vascular plants. SDMs were fitted using an ensemble SDM framework. I also validated modelled niche optima against empirical field measurements to ensure ecological realism and I evaluated models against independent occurrence records from GBIF.

The analysis separated diagnostic species (indicators of specific wetland types) from non-diagnostic species, and distinguished between vascular plants and mosses to account for their different ecological requirements.

Read more on methodology here


Key Findings

Key findings visualization
  • The predictive power of models fitted for diagnostic mosses was the highest where as the non-diagnostic species showed lowest performance.
  • Climate variables, particularly the mean temperature of the coldest month, were the strongest predictors of species occurrence. At the same time,groundwater table depth was a significant predictor for diagnostic vascular plants but not for mosses.
  • The correlations between the modelled niche optimas and emperical optimas were in the expected directions representing a strong ecological realism of the models.
  • The SDMs are suitable for predicting broad-scale patterns of wetland plant species distributions.However, alternative or additional variables or a different modelling approach might be needed to represent better the local heterogeneity in the hydrological conditions of wetlands

Reflections

This project was specially challenging because I was working with an ecosystem that was largely new to me while rapidly building beyond my basic programming and modelling skills.


Hand drawn illustration by Ojaswi Sumbh